Quote:
Originally Posted by Lamboda

You can look back on my post history and I've been consistently saying the same thing and what I've said is happening at the moment.
|
Even a broken clock is wrong twice a day.
Behavioral finance is a really interesting area of study and there are a bunch of well-documented totally common responses that we have as humans that make it hard to make good decisions around investing.
As humans, we generally have no problem visualizing the risk around making an investment and having it go down in value. However, we generally do not accurately assess the cost of NOT making the investment - the opportunity cost.
My dad has been citing numbers, facts, and figures for a decade about how Vancouver real estate is detached from fundamentals, is in a bubble, will end up having a huge drawdown at some point, and so on. At some point, he'll be right, but the number of years that he's been wrong will mean that overall he'll be worse off.
The same is absolutely true in the stock market. It is easy to sit here and pick things apart in the market and point out risks, and talk about sitting out, but our clients who are in the 100% equity portfolio are up approximately 17% for 2023 so far. That's the cost of sitting on the sideline and 'waiting for the crash' that may or may not happen.
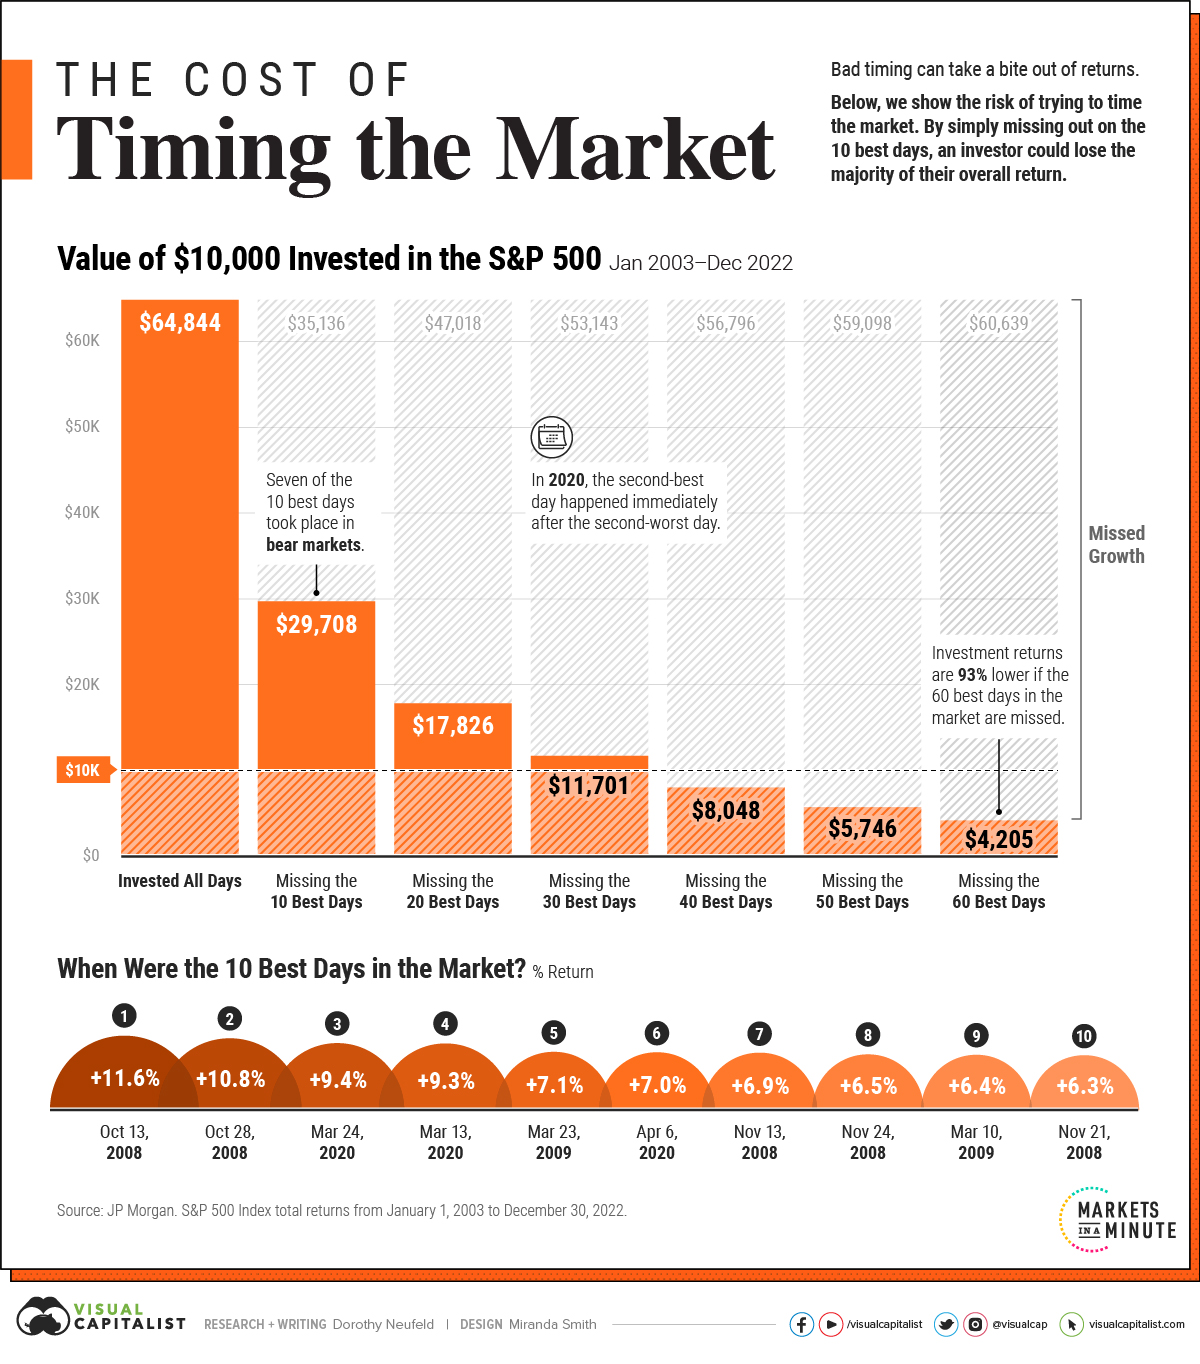
I think this is a great chart. The really important takeaway is a) if you just missed a few days, you are a lot worse off, and b) more importantly
7/10 best return days in the last 20 years were in bear markets (periods of time that people were afraid, critical, and generally "sitting out")
-Mark